RISR Commentary for October 2022

Performance Summary
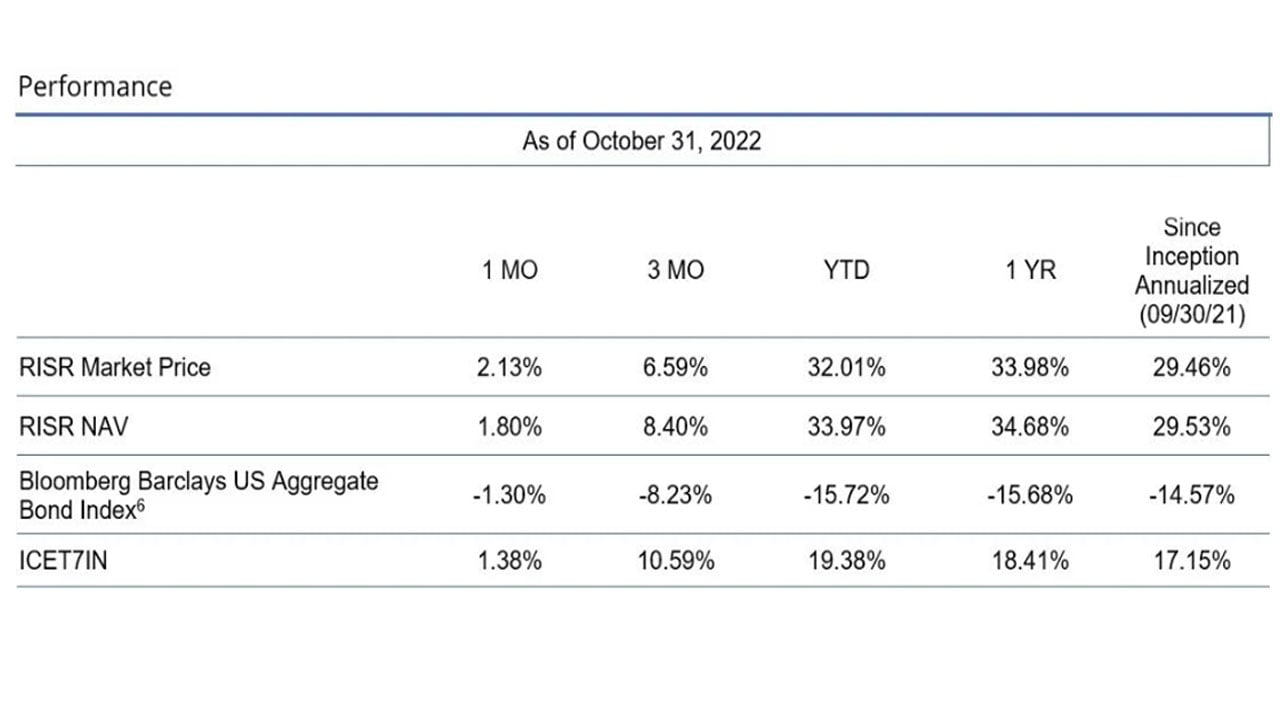
The FolioBeyond Rising Rates ETF (ticker: RISR) returned 2.13% based on the closing market price (1.80% based on net asset value or “NAV”) in October. In comparison, the ICET7IN Index (US Treasury 7 Year Bond Inversed Index) returned 1.38% while the Bloomberg Barclays U.S. Aggregate Bond Index ("AGG") returned -1.30% during the same period. This performance was almost precisely in line with the fund’s target duration, as the 10-year treasury yield moved up by roughly 21.8 basis points (bps) during the month. We achieved this despite an extreme degree of continuing market volatility that saw a trough to peak range of 60 bps—from 3.64% to 4.24%—in the yield on the 10-year Treasury over the course of the month.
We saw meaningful capital inflows in October, which increased our shares outstanding by 7%. We are having extensive discussions with several large investment platforms used by advisors and investors managing many billions of dollars in AUM, and we are hopeful that RISR will be even more broadly available to RIAs later this year and into 2023. It is important to be available on these platforms in order to have the broadest appeal.
Another milestone reached in October was the one-year anniversary of the fund’s launch. RISR was officially launched on October 1, 2021. This is important because many investors and advisors have a requirement that any ETF in which they invest have a minimum one-year track record of actual realized returns.
One final announcement is that we made the decision in October to stabilize RISR’s monthly dividend at a rate of $0.18 per share. At the October 31 closing price, that corresponds to an annualized equivalent yield of 6.74% (RISR has a current 30 Day SEC Yield of 7.52%). We made this decision in order to provide predictability to investors, many of whom have told us they value stability of income. It is our intention to maintain the dividend at this rate for the next several months, at least, although actual dividend distributions in the long run may be higher or lower than this amount based on market conditions which are never perfectly predictable.
Outlook
Capitulation was a term heard frequently last month. The general-purpose synonym of this word is to surrender. In financial markets it includes that narrow meaning, but there is an additional aspect that recognizes a final, belated realization that a hoped for rebound or recovery of prior losses is not going to happen. Hope springs eternal in the heart of investors, but the idea that the Federal Reserve would be able to engineer a soft-landing based on a “pivot” to a less hawkish policy gained broader acceptance. Capitulation occurs when investors broadly concede that the losses they have been suffering are not going to be reversed quickly, and that additional losses are more likely than not.
One indication of that sentiment is the frequency with which users search Google for the phrase “Buy the Dip.” This phrase is an indicator of positive sentiment during periods of market volatility. As the graph below shows, searches for this phrase have dropped sharply over the last several months, after a series of spikes earlier in the year.

Likewise, searches for the phrase “Rising Interest Rates” picked up sustained frequency during September and October, after declining during this past summer’s false hope for a soft landing, and a presumed easing of the Federal Reserve’s inflation fighting plans. Both of these are signs of capitulation.

As is painfully apparent to everyone who shops and pays bills, producer prices and consumer prices continued their relentless rise last month, and most inflation measures reported during the month exceeded market expectations. It is entirely possible that going forward we may see some moderation in some components of reported inflation. We urge investors not to be lulled into complacency by such headlines if and when they occur. The reported inflation numbers are compiled by the Bureau of Labor Statistics (BLS) using a wide range of data sources, and complex algorithms to make a large number of adjustments and weightings, some of which are worthy of healthy skepticism as a guide to monetary policy.[1] Moreover, some policy makers prefer to look at inflation excluding the costs for food and energy, as those components are said to be “volatile.” In the current environment, when sustained increases for food and energy particularly are at the heart of the inflation problem, globally, that preference makes little sense. Another key component of reported inflation is housing. For purposes of computing the official statistics, home prices are converted into a price change by computing something called “owner’s equivalent rent.” Many observers have long argued that this is a deeply flawed measure of realized housing costs.
Meanwhile labor markets remained tight as job openings stayed high and labor participation failed to increase to meet the robust demand for workers. Wages failed to keep up with prices, however, so inflation-adjusted “real” worker earnings declined again as they have each month since Q2 of 2021. The cumulative decline in real pay is significant, and will continue to worsen household standards of living until inflation is brought back under control.

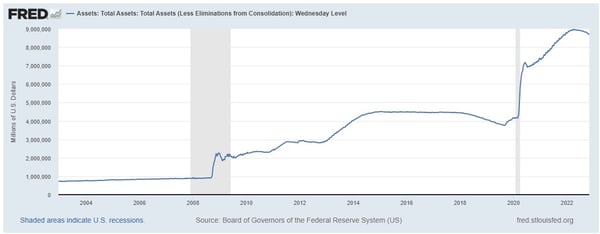
While we believe they need to continue to raise interest rates further and keep them there longer than the market consensus, the Federal Reserve has another massive challenge—its exceedingly bloated balance sheet. Since the financial crisis or 2007 and in the aftermath of the covid pandemic, the Fed acquired assets (mostly Treasury securities and Agency MBS) on a scale never seen before.
As the graph below shows, the Federal Reserve tended for many years to hold something like one trillion dollars of securities on its balance sheet. In the wake of the 2007 financial crisis, that number doubled to a little over two trillion. But then, rather than declining as the crisis faded, they continued to buy steadily for another 7 years, reaching a total of $4.5 trillion by mid-2015. And then, in a “what were they thinking” moment when covid began to spread around the world, they bought another $3 trillion, and kept buying until their holdings peaked at around $9 trillion.

There are many reasons the Fed must and will reduce this. For one simple reason, it grossly distorts the financial markets to have the Federal Reserve play such an outsized role. It is one thing for a central bank to act as the buyer of last resort during an exigent crisis. It something else altogether, to dominate the market for US government bonds and MBS for well over a decade.
The important takeaway from this is to note that even if the Fed pauses in its raising of the short-term federal funds rate, the overhang of these longer maturity holdings and the market’s capacity to digest them is likely to keep bond prices low, and therefore interest rates high, for an extended period of time. Normalizing the Fed’s balance sheet is almost surely going to take years.
As we have noted previously, we see strong global forces tending to push inflation and interest rates higher at least through 2023. Even if the Fed decides to take a break or a pause at some point next year, we believe the odds are very low for a sustained material decline in inflation or interest rates anytime soon. There are many investors who agree with that outlook, and we hope RISR can continue to be a useful product for them to express that viewpoint.
However, we designed RISR to have broad appeal to a range of investors, including those who have a more sanguine view. We noted above the stable, attractive dividend we have been able to produce. This is dividend yield that is well above the broad fixed income market; the AGG broad fixed income ETF currently yields 4.28%. That high rate of current income, combined with RISRs modest volatility [2] (volatility represents standard deviation) we believe make it attractive for income-oriented investors.
Finally, we believe that RISR’s low correlation to other market sectors makes it a great diversifier to a wide range of investors, including traditional 60/40 or other model allocations, or investors focused more directly on fixed income. Please contact us to explore how RISR might fit into your overall strategy, to help you manage risk, while generating an attractive current yield.

The performance data quoted represents past performance. Past performance does not guarantee future results. The investment return and principal value of an investment will fluctuate so that an investor’s shares, when sold or redeemed, may be worth more or less than their original cost and current performance may be lower or higher than the performance quoted. Performance current to the most recent month-end can be obtained by calling 866-497-4963. Short term performance, in particular, is not a good indication of the fund’s future performance, and an investment should not be made based solely on returns. Returns beyond 1 year are annualized.
A fund's NAV is the sum of all its assets less any liabilities, divided by the number of shares outstanding. The market price is the most recent price at which the fund was traded. The fund intends to pay out income, if any, monthly. There is no guarantee these distributions will be made.
Total Expense Ratio is 1.01%.
For standardized performance click here
Portfolio Applications
We believe RISR provides an attractive, thematic strategy that provide strong correlation benefits for both fixed income and equity portfolios. It can be utilized as part of a core holding for diversified portfolios or as an overlay to manage the interest rate risk of fixed income portfolios. Alternatively, RISR can be used as a macro hedge against rising interest rates with less exposure to equity beta and negative correlation to fixed income beta. The underlying bonds are all U.S. agency credit that are guaranteed by FNMA, FHLMC or GNMA. There is no financing leverage or explicit short positions that relies on borrowed securities. Also, timing is on our side as the strategy generates current income if interest rates were to remain within a trading range.
Please contact us to explore how RISR can be utilized as a unique tool to adjust your portfolio allocations in the current inflationary environment.
| Yung Lim | Dean Smith | George Lucaci |
|---|---|---|
| Chief Executive Officer | Chief Strategist and Marketing Officer | Global Head of Distribution |
| Chief Investment Officer | RISR Portfolio Manager | |
| ylim@foliobeyond.com | dsmith@foliobeyond.com | glucaci@foliobeyond.com |
| 917-892-9075 | 914-523-2180 | 908-723-3372 |
Investors should consider the investment objectives, risks, charges and expenses carefully before investing. For a prospectus or summary prospectus with this and other information about the Fund, please call (866) 497-4963 or visit our website at www.etfs.foliobeyond.com. Read the prospectus or summary prospectus carefully before investing.
Investments involve risk. Principal loss is possible. Unlike mutual funds, ETFs may trade at a premium or discount to their net asset value. The fund is new and has limited operating history to judge fund risks. The value of MBS IOs is more volatile than other types of mortgage related securities. They are very sensitive not only to declining interest rates, but also to the rate of prepayments. MBS IOs involve the risk that borrowers may default on their mortgage obligations or the guarantees underlying the mortgage-backed securities will default or otherwise fail and that, during periods of falling interest rates, mortgage-backed securities will be called or prepaid, which may result in the Fund having to reinvest proceeds in other investments at a lower interest rate.
The Fund’s derivative investments have risks, including the imperfect correlation between the value of such instruments and the underlying assets or index; the loss of principal, including the potential loss of amounts greater than the initial amount invested in the derivative instrument. The value of the Fund’s investments in fixed income securities (not including MBS IOs) will fluctuate with changes in interest rates. Typically, a rise in interest rates causes a decline in the value of fixed income securities owned indirectly by the Fund. Please see the prospectus for a complete description of principal risks.
Diversification does not eliminate the risk of experiencing investment losses.
Footnotes
[1] Some years ago, a former Fed official was heckled when he stated in a speech that increases in food prices could be offset by improvements in the functionality of Apple iPads. To which an audience member shouted, “But I can’t eat an iPad!”
[1] RISR 30-day volatility is 12%. Source: Bloomberg, L.P.
Index Definitions
Bloomberg Barclays US Aggregate Bond Index: A broad-based benchmark that measures the investment grade, US dollar-denominated, fixed-rate taxable bond market. The index includes Treasuries, government-related and corporate securities, MBS (agency fixed-rate and hybrid ARM pass-throughs), ABS and CMBS (agency and non-agency).
US Treasury 7-10 Yr Bond Inverse Index:
ICE U.S. Treasury 7-10 Year Bond 1X Inverse Index is designed to provide the inverse of the daily return of the ICE U.S. Treasury 7-10 Year Bond Index (IDCOT7). ICE U.S. Treasury 7-10 Year Bond Index tracks the performance of US dollar denominated sovereign debt publicly issued by the US government in its domestic market. Qualifying securities of the underlying index must have greater than or equal to seven years and less than 10 years remaining term to final maturity as of the rebalancing date, a fixed coupon schedule and an adjusted amount outstanding of at least $300 million.
S&P 500 (Standard & Poors 500):
The S&P 500 Index represents a market-capitalization weighted index of 500 leading publicly traded companies in the U.S, as defined by the Standard & Poors corporation.
Definitions
Alpha: a return achieved above and beyond the return of a benchmark or proxy with a similar risk level.
Annualized Equivalent Yield: represents the annualized yield based on the most recent month of income distribution : (income distribution x 12 months)/price per share.
Basis Points (bps): Is a unit of measure used in quoting yields, changes in yields or differences between yields. One basis point is equal to 0.01%, or one one-hundredth of a percent of yield and 100 basis points equals 1%.
Beta measures: the volatility of a security or portfolio relative to an index. Less than one means lower volatility than the index; more than one means greater volatility.
Coupon: is the annual interest rate paid on a bond, expressed as a percentage of the bond’s face value.
Convexity: A measure of how the duration of a bond changes in correlation to an interest rate change. The greater the convexity of a bond the greater the exposure of interest rate risk to the portfolio.
CUSIP : An identifier number that stands for the Committee on Uniform Securities Identification Procedures assigned to stocks and registered bonds in the United States and Canada.
Duration: measures a bond price’s sensitivity to changes in interest rates. The longer a bond’s duration, the higher its sensitivity to changes in interest rates and vice versa.
GNMA: Government National Mortgage Association
FNMA: Federal National Mortgage Association
FHLMC: Federal Home Loan Mortgage Corporation
Producer Price Index (PPI) : is a family of indexes that measures the average change over time in selling prices received by domestic producers of goods and services. PPIs measure price change from the perspective of the seller. This contrasts with other measures, such as the Consumer Price Index (CPI), that measure price change from the purchaser's perspective. Sellers' and purchasers' prices may differ due to government subsidies, sales and excise taxes, and distribution costs.
Short Investment (Shorting): is a position that has been sold with the expectation that it will decrease in value, the intention being to repurchase it later at a lower price.
Distributed by Foreside Fund Services, LLC.


