RISR Commentary for February 2023

Performance Summary
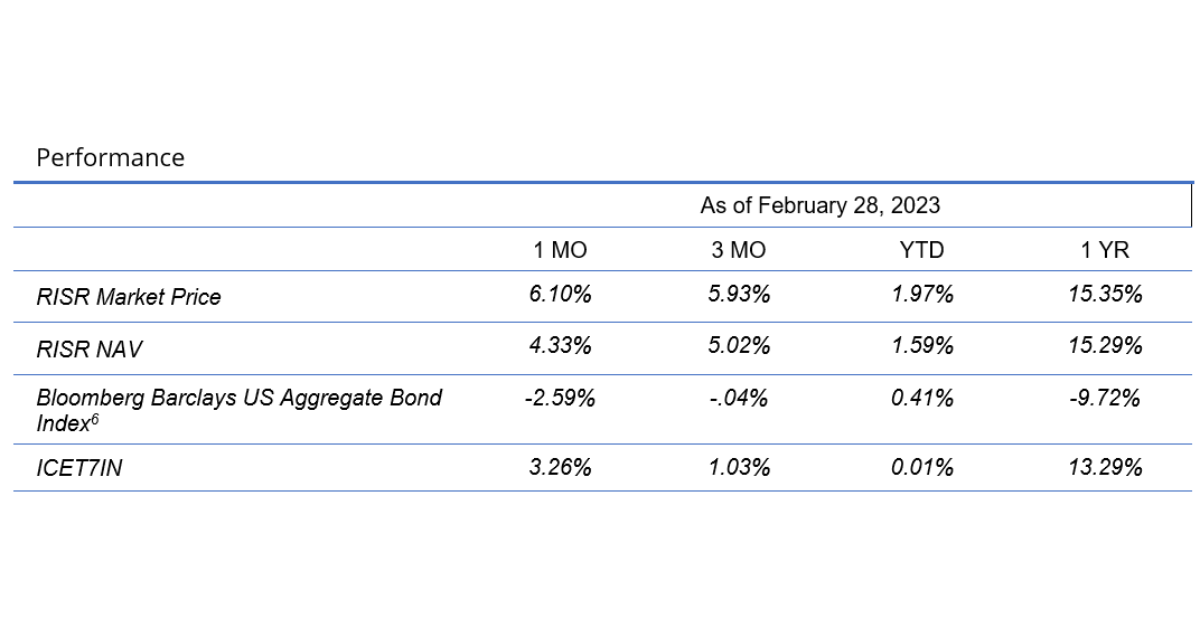
The FolioBeyond Rising Rates ETF (ticker: RISR) returned 6.1% based on the closing market price (4.33% based on net asset value or “NAV”) in February. In comparison, the ICET7IN Index (US Treasury 7-Year Bond Inversed Index) returned 3.26% while the Bloomberg Barclays U.S. Aggregate Bond Index ("AGG") returned -2. 59% during the same period. Thus, the start to 2023 saw more of the see-saw performance in interest rates we saw throughout 2022.
The month began with a widely anticipated 25 bps hike in the Fed Funds rate announced on February 1, bringing the target to 4.75%. This represented a slowdown from a series of 50 and 75 bps hikes throughout 2022. While there was some debate in the market over whether 25 or 50 bps was appropriate, the Fed chose the lower figure due to slightly softer inflation indicators in the period just before the rate decision.
Naturally, that decision was very quickly “mugged by reality” as a blockbuster non-farm payroll (NFP) number was released just two days later. The expectation for 189 thousand new jobs was blown out of the water by a print of 517 thousand new jobs added in January. If anyone had a forecast for a jump of that magnitude, we certainly never saw it. This was accompanied by an unemployment rate that dropped to 3.4%. You would have to go back to 1969 to see an unemployment rate that low! We need a stronger word than “strong” to describe the current US Labor market.
Not surprisingly, this produced a dramatic and volatile re-assessment for the future path of Federal Reserve monetary policy. The 10-year Treasury rate, which had fallen to 3.40% on the Fed’s reduced rate hike, immediately reversed course and jumped to 3.64% after the NFP report. It continued to climb from there and ended the month at 3.92%. That was the highest rate since last November. Mortgage spreads also widened over the month. Both of these combined to drive RISR’s performance in February, which was one of the best monthly returns since the inception of the Fund.
The rapid reassessment regarding the future path for inflation and, therefore, rates began quickly. On February 15th the Wall Street Journal published a piece headlined: “Markets Come to Grips With the Fed on Interest Rates - Traders give up on hopes for a central-bank policy pivot, for now.” The long anticipated, widely hoped-for “pivot,” whereby the Fed would stop hiking and start cutting rates was finally off the table. We have long expressed the view that the potential for a pivot by the Fed was more a case of wishful thinking than an actual forecast. That is how the Fund is being managed. We aim to provide a non-correlated return profile to equities and the broader bond market, while also provided protection against higher rates overall, with a high rate of current income. That was achieved in February.
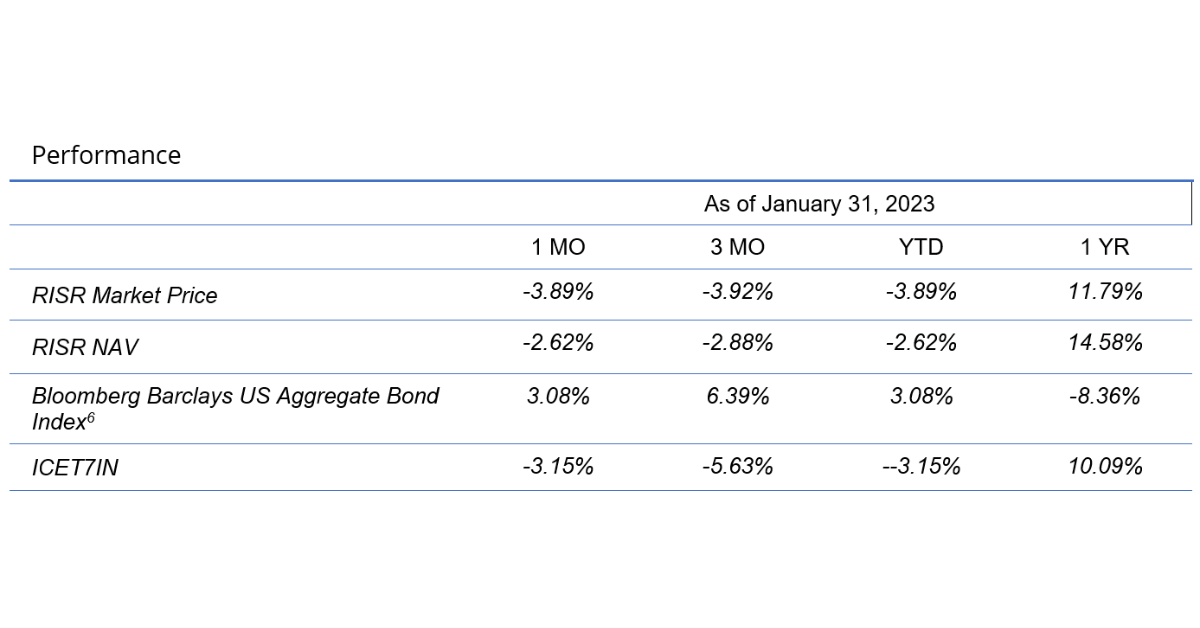
As was the case in January, we maintained our stabilized dividend of $0.18/share in February. It is our intention to maintain this rate, although it cannot be guaranteed. As of now, the cash flow yield on our current portfolio is above the level needed to maintain that rate.
Outlook
If this letter were being written immediately after the end of the month, that is where things would stand. A super-hot job market, and a growing consensus that Fed policy would amount to interest rates that were going to be “higher for longer” than many observers were predicting just a short time ago.
However, just a week into March, seemingly everything changed. A bank most people had probably never heard of, Silicon Valley Bank (SVB), collapsed with stunning suddeness. As is now well known, the 16th largest bank in the US by assets, had simply been running a massive, long, unhedged Treasury and MBS position. It isn’t clear what the management team was thinking (or if they were thinking at all), but the market value of that portfolio was down massively by early 2023. It’s also not clear that any regulator was aware of this. Additional facts will presumably come to light over time.
The collapse of SVB triggered investors to take a hard look at other institutions that might have similar problems, and within a few days the market had turned into a full-blown banking panic. Working with the FDIC and the Treasury, the Federal Reserve quickly put up a new lending facility, whereby banks could borrow against the face value—not the much lower market value—of the Treasury and MBS assets. Anyone who lived through 2008 undoubtedly felt a frisson of those horrible times. Concern spread to Europe, and especially Credit Suisse, who had to draw on a special SWF 50 billion credit line from the Swiss central bank.
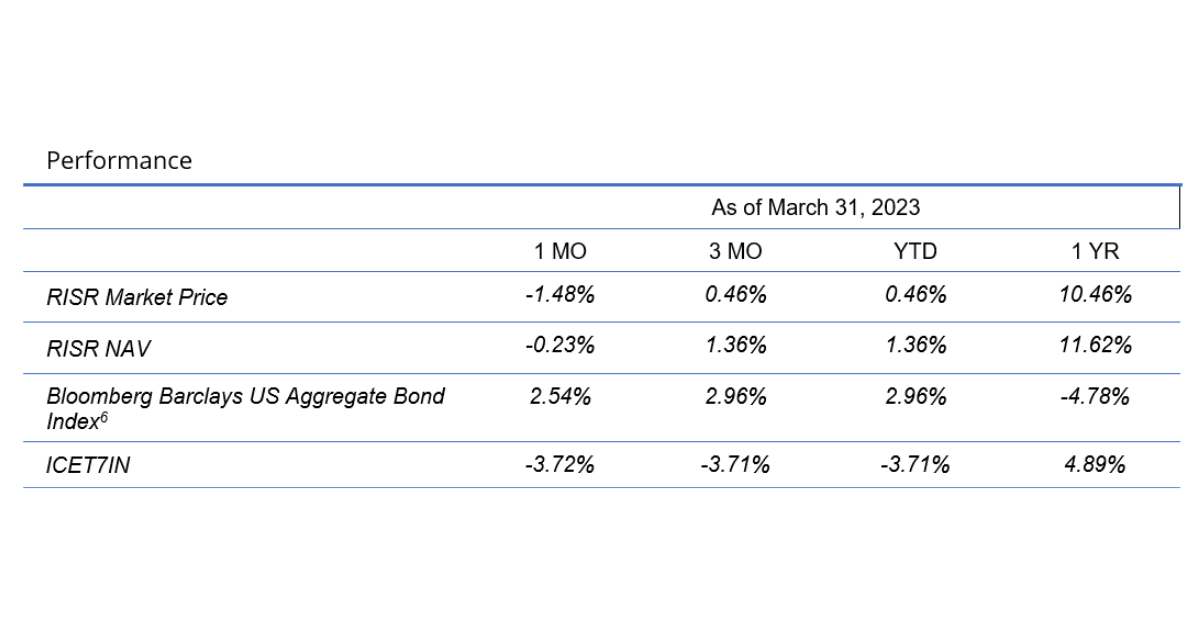
For the moment, things seem to have settled down. But inflation is still running hot, the labor market shows no sign of cooling, and the Fed’s predicament just got worse. It is impossible to predict where we go from here. The public has not been made fully aware of all the banks or other entities that may be experiencing distress. Hedge Funds and CTAs are frequently mentioned. The only thing surprising about this is that anyone is surprised. We are living through the reversal of a generation-long experiment in monetary policy that saw interest rates repressed to essentially zero. There was no way this was ever going to be quick, easy or painless.
During February, an important paper was presented at a high-level meeting of central bankers and policy makers at the University of Chicago Booth School.[1] In that very detailed and well researched paper, the authors describe the many challenges of managing a disinflationary policy. In the paper they state: “[T]he Fed will need to tighten policy significantly further to achieve its inflation objective by the end of 2025. Going forward, our analysis supports a return to a strategy of preemptive policy.”
They further say: “[T]here is no post-1950 precedent for a sizable central-bank-induced disinflation that does not entail substantial economic sacrifice or recession.” The only way to avoid these adverse effects, include stress on commercial banks, is to give up the fight, and let inflation accelerate. The Federal Reserve and the European Central Bank have both unemphatically ruled that out. In our view this means that once the immediate bank panic is over, and a sense of relative calm is restored over the potential for full-scale financial system collapse, then central banks will have to resume their rate hikes. Restoring calm might take weeks or it might take a few months, but the idea that inflation will simply decline on its own has been pretty fully debunked.
Higher for longer, is the stance we have taken since we launched RISR, and we still think it is the right position for prudent investors and investment advisors. We think it still makes sense to shorten duration, and to be very cautious in adding credit risk. RISR can help in that task.
We designed RISR to have broad appeal to a range of investors, including those who have a more sanguine view, than ours, but who also agree with the wisdom of prudently managing risk. RISR can help in that effort, offering a low correlation to many key market sectors, together with a high current dividend.
Please contact us to explore how RISR might fit into your overall strategy, to help you manage risk while generating an attractive current yield.

The performance data quoted represents past performance. Past performance does not guarantee future results. The investment return and principal value of an investment will fluctuate so that an investor’s shares, when sold or redeemed, may be worth more or less than their original cost and current performance may be lower or higher than the performance quoted. Performance current to the most recent month-end can be obtained by calling 866-497-4963. Short term performance, in particular, is not a good indication of the fund’s future performance, and an investment should not be made based solely on returns. Returns beyond 1 year are annualized.
A fund's NAV is the sum of all its assets less any liabilities, divided by the number of shares outstanding. The market price is the most recent price at which the fund was traded. The fund intends to pay out income, if any, monthly. There is no guarantee these distributions will be made.
Total Expense Ratio is 0.99%.
For standardized performance click here
Portfolio Applications
We believe RISR provides an attractive, thematic strategy that provides strong correlation benefits for both fixed income and equity portfolios. It can be utilized as part of a core holding for diversified portfolios or as an overlay to manage the interest rate risk of fixed income portfolios. Alternatively, RISR can be used as a macro hedge against rising interest rates with less exposure to equity beta and negative correlation to fixed income beta. The underlying bonds are all U.S. agency credit that are guaranteed by FNMA, FHLMC or GNMA. There is no financing leverage or explicit short positions that relies on borrowed securities. Also, timing is on our side as the strategy generates current income if interest rates were to remain within a trading range.
Please contact us to explore how RISR can be utilized as a unique tool to adjust your portfolio allocations in the current inflationary environment.
| Yung Lim | Dean Smith | George Lucaci |
|---|---|---|
| Chief Executive Officer | Chief Strategist and Marketing Officer | Global Head of Distribution |
| Chief Investment Officer | RISR Portfolio Manager | |
| ylim@foliobeyond.com | dsmith@foliobeyond.com | glucaci@foliobeyond.com |
| 917-892-9075 | 914-523-2180 | 908-723-3372 |
This material must be preceded or accompanied by a prospectus. For a copy of the prospectus please click here.
Investments involve risk. Principal loss is possible. Unlike mutual funds, ETFs may trade at a premium or discount to their net asset value. The fund is new and has limited operating history to judge fund risks. The value of MBS IOs is more volatile than other types of mortgage related securities. They are very sensitive not only to declining interest rates, but also to the rate of prepayments. MBS IOs involve the risk that borrowers may default on their mortgage obligations or the guarantees underlying the mortgage-backed securities will default or otherwise fail and that, during periods of falling interest rates, mortgage-backed securities will be called or prepaid, which may result in the Fund having to reinvest proceeds in other investments at a lower interest rate.
The Fund’s derivative investments have risks, including the imperfect correlation between the value of such instruments and the underlying assets or index; the loss of principal, including the potential loss of amounts greater than the initial amount invested in the derivative instrument. The value of the Fund’s investments in fixed income securities (not including MBS IOs) will fluctuate with changes in interest rates. Typically, a rise in interest rates causes a decline in the value of fixed income securities owned indirectly by the Fund. Please see the prospectus for a complete description of principal risks.
Diversification does not eliminate the risk of experiencing investment losses.
Footnotes
[1] https://www.chicagobooth.edu/-/media/research/igm/docs/usmpf-2023-conference-version.pdf
Index Definitions
Bloomberg Barclays US Aggregate Bond Index: A broad-based benchmark that measures the investment grade, US dollar-denominated, fixed-rate taxable bond market. The index includes Treasuries, government-related and corporate securities, MBS (agency fixed-rate and hybrid ARM pass-throughs), ABS and CMBS (agency and non-agency).
US Treasury 7-10 Yr Bond Inversed Index: ICE U.S. Treasury 7-10 Year Bond 1X Inverse Index is designed to provide the inverse of the daily return of the ICE U.S. Treasury 7-10 Year Bond Index (IDCOT7). ICE U.S. Treasury 7-10 Year Bond Index tracks the performance of US dollar denominated sovereign debt publicly issued by the US government in its domestic market. Qualifying securities of the underlying index must have greater than or equal to seven years and less than 10 years remaining term to final maturity as of the rebalancing date, a fixed coupon schedule and an adjusted amount outstanding of at least $300 million.
S&P 500 Index: The S&P 500 Index, or Standard & Poor's 500 Index, is a market-capitalization-weighted index of 500 leading publicly traded companies in the U.S.
IBOXHY Index: iBoxx USD Liquid High Yield Total Return Index measures the USD denominated, sub-investment grade, corporate bond market. The index includes bonds with minimum 1 years to maturity,
minimum amount outstanding of USD 400 mil. Bond type includes fixed-coupon, step-up, bonds with
sinking funds, medium term notes, callable and putable bonds.
Definitions
Alpha: a return achieved above and beyond the return of a benchmark or proxy with a similar risk level.
Annualized Equivalent Yield: represents the annualized yield based on the most recent month of income distribution : (income distribution x 12 months)/price per share.
Basis Points (bps): Is a unit of measure used in quoting yields, changes in yields or differences between yields. One basis point is equal to 0.01%, or one one-hundredth of a percent of yield and 100 basis points equals 1%.
Beta measures: the volatility of a security or portfolio relative to an index. Less than one means lower volatility than the index; more than one means greater volatility.
Coupon: is the annual interest rate paid on a bond, expressed as a percentage of the bond’s face value.
Correlation: a statistic that measures the degree to which two securities move in relation to each other.
Convexity: A measure of how the duration of a bond changes in correlation to an interest rate change. The greater the convexity of a bond the greater the exposure of interest rate risk to the portfolio.
CUSIP: An identifier number that stands for the Committee on Uniform Securities Identification Procedures assigned to stocks and registered bonds in the United States and Canada.
Duration: measures a bond price’s sensitivity to changes in interest rates. The longer a bond’s duration, the higher its sensitivity to changes in interest rates and vice versa.
GNMA: Government National Mortgage Association
FNMA: Federal National Mortgage Association
FHLMC: Federal Home Loan Mortgage Corporation
Short Investment (Shorting): is a position that has been sold with the expectation that it will decrease in value, the intention being to repurchase it later at a lower price.
Distributed by Foreside Fund Services, LLC.


